You are a Founder of a bright and shiny business, or a Product Manager looking to make an immediate impact in a new team.
People around you say things like,
“We are flying blind; we don’t have any metrics to look at”
“We have multiple sources of data, but don’t know how to stitch it all together”
If this is you, it’s time to include building a modern data stack in your roadmap.

This article presents a framework you can use to get your modern data stack off the ground.
Where you are right now
Let’s assume:
- Your business has a website
- You handle payments through a payment processor like Stripe or PayPal
- You advertise using Google Ads / Meta Ads
- You have an MVP product that generates data
The framework for building your modern data stack
You should spend a few extra brain cycles on day zero to think about how your data stack will evolve as your business grows. This is exactly what this framework helps with — build once, and use multiple times.
There are 4 steps. Let’s go through them one by one.
Step 1 — Figure out your constraints
As with any project, start with identifying your constraints,
Speed
- Do you want answers immediately? Maybe you have an upcoming board meeting for which you need these metrics?
- Or, can you wait a bit and build something future proof?
$$
- What’s your budget for this project? Make sure to include any software related recurring expenses.
- Do you plan on hiring data experts to support this project in the future?
Complexity
- How many sources of data do you need to handle?
- How specialized will your insights and metrics become later down the road? Will you need to slice your data across multiple geos, channels, customer profiles?
Team’s data savviness
- Can anyone on your team code? Can they write SQL?
- Or, is a no-code solution needed?
Future requirements
- What data do you need today? What do you need 6 months, or a year from now?
- Will this data give you a competitive advantage in the future, even if it doesn’t today?
Step 2 — List your core metrics
Simple and easily explainable metrics are powerful; prioritize them. Once you have a handle on your constraints, talk to your team and hone in on what you want to measure.
We’ll use the metric — LTV/CAC as a working example to walk you through the next two steps.
(LTV is the average ‘Life Time Value’ of your customer, and CAC is the average ‘Customer Acquisition Cost’. This is a useful ratio for any subscription business to track as it gives you a direct relationship between the average revenue you receive per customer and the amount you spend in acquiring them.)
Step 3 — Break down your metrics and draw a line to their sources
Break down your core metrics into smaller and more digestible pieces. The goal of this step is to identify your inputs and map them to their source app.
Let’s apply this to our working example.

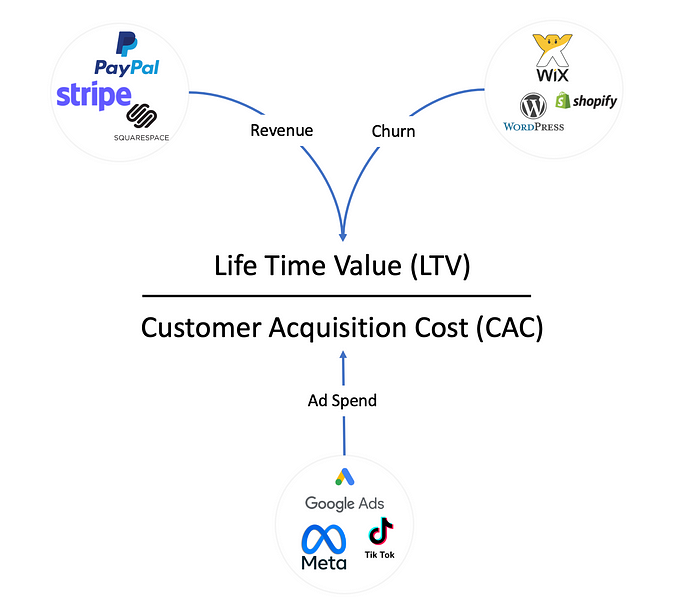
In the diagram above, you can see that LTV depends on revenue and churn, which is sourced from your payment processor (Stripe/PayPal) and from your website/app (WordPress, Shopify) respectively.
Similarly, CAC comes from your ad spend (For the sake of simplicity, we have assumed sales commissions and other sales related spend is non-existent)
(Check out the Helpful Equations section at the bottom of the article to see how we arrived at the inputs in the diagram)
Step 4 — Assemble the data stack
This is it; we are in the end game. Now we have everything we need to finally start building.

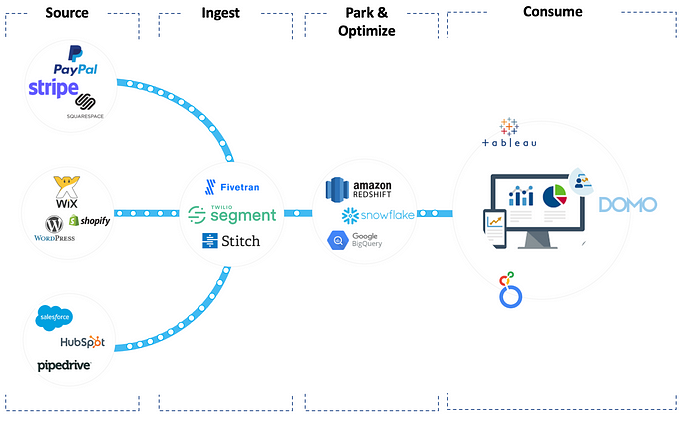
A data stack has the following blocks,
Source
You have a list of sources/tools from Step 3. Every tool you use has dedicated hooks that help you connect to their backend data store. Build a list of these APIs/Webhooks and create the necessary access permissions.
Data Source examples: Stripe/PayPal, Product App, Website, CRM…
Ingest
Connect all your data sources, and then siphon, clean, and transport your data to a warehouse or visualization tool. Customer Data Platforms (CDPs) like Segment provide simple user interfaces to do this. There are other tools such as Stitch and Fivetran that will work as well.
It doesn’t matter which tool you use as long as it is compatible with all your source and destination apps.
Ingestion Tool examples: Segment, Fivetran, Stitch
Park & Optimize [Optional]
You can choose to clean and model your data in a warehouse before consuming it. Doing so will lower your data fees and reduce the burden on your visualization tool. Note, you will need in-house SQL expertise in order to do this.
Data Warehouse Tool examples: Snowflake, Amazon Redshift/ Google BigQuery/ Microsoft Azure
Consume
Finally, link your data to a BI/visualization tool. Note, if you decided to skip the ‘park & optimize’ step, you will need a feature rich visualization tool. Tools like Tableau or Domo can handle heavy data wrangling and let you interact with them in a No-code fashion (drag and drop); they also cost you $$.
You are now ready to create meaningful charts to track your business!
Visualization Tool examples: Looker, Tableau, Mixpanel, Domo
Close
We hope this framework gets you started on your journey to create your company’s data stack. There are several data tools out there and we have intentionally shied away from prescribing a holy grail solution.
Do you have any other questions that we can answer? How would you build your data stack?
Reach out to us with your comments, or questions, we’re super interested in your perspective!
…
Helpful Equations
LTV/CAC
LTV/CAC = Average Life Time Value (LTV)/ Customer Acquisition Cost (CAC)
LTV
LTV = Average Revenue Per User (ARPU)/ Churn
ARPU
ARPU = Revenue for a given period / Number Of Customers in that period
Churn
Churn = Customers Who Left This Period/ Customers At Start Of Period
CAC
CAC = Total Spent On Customer Acquisition/Customers Acquired